17 May, 2017
Translating the Tunnel to the Road
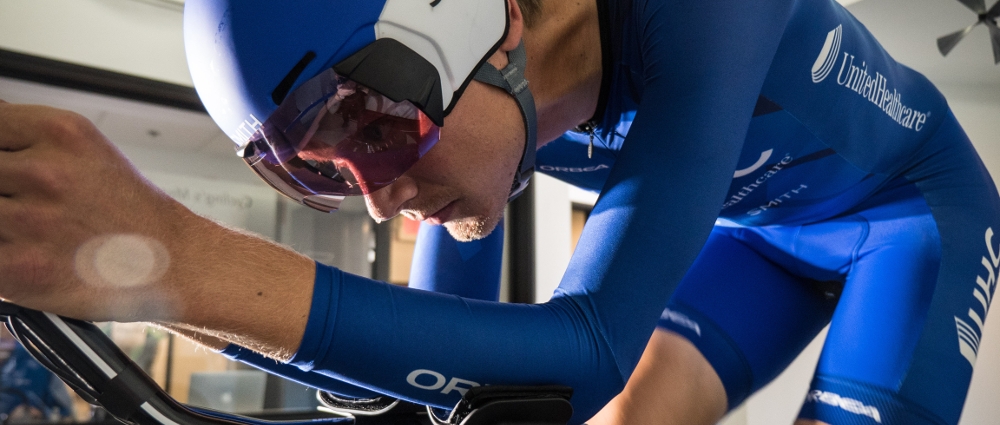
We're sharing with you this (very interesting) article from Trainingpeaks that analyzes the intensive work carried out in the wind tunnel by the UnitedHealthcare Pro Cycling Team riders and the technicians from Best Bike Split. The goal? To optimize the cyclists’ performance on their Ordus by analyzing their aerodynamic position on the bike.
Over our short history at Best Bike Split we have had the pleasure of working with several pro cycling teams and many pro triathletes. Every experience has help shaped our product and how we approach enhancements and new developments. This year a friend (and an amazing coach) Ben Day was tapped to become the High Performance Director of the UnitedHealthcare Pro Cycling team.
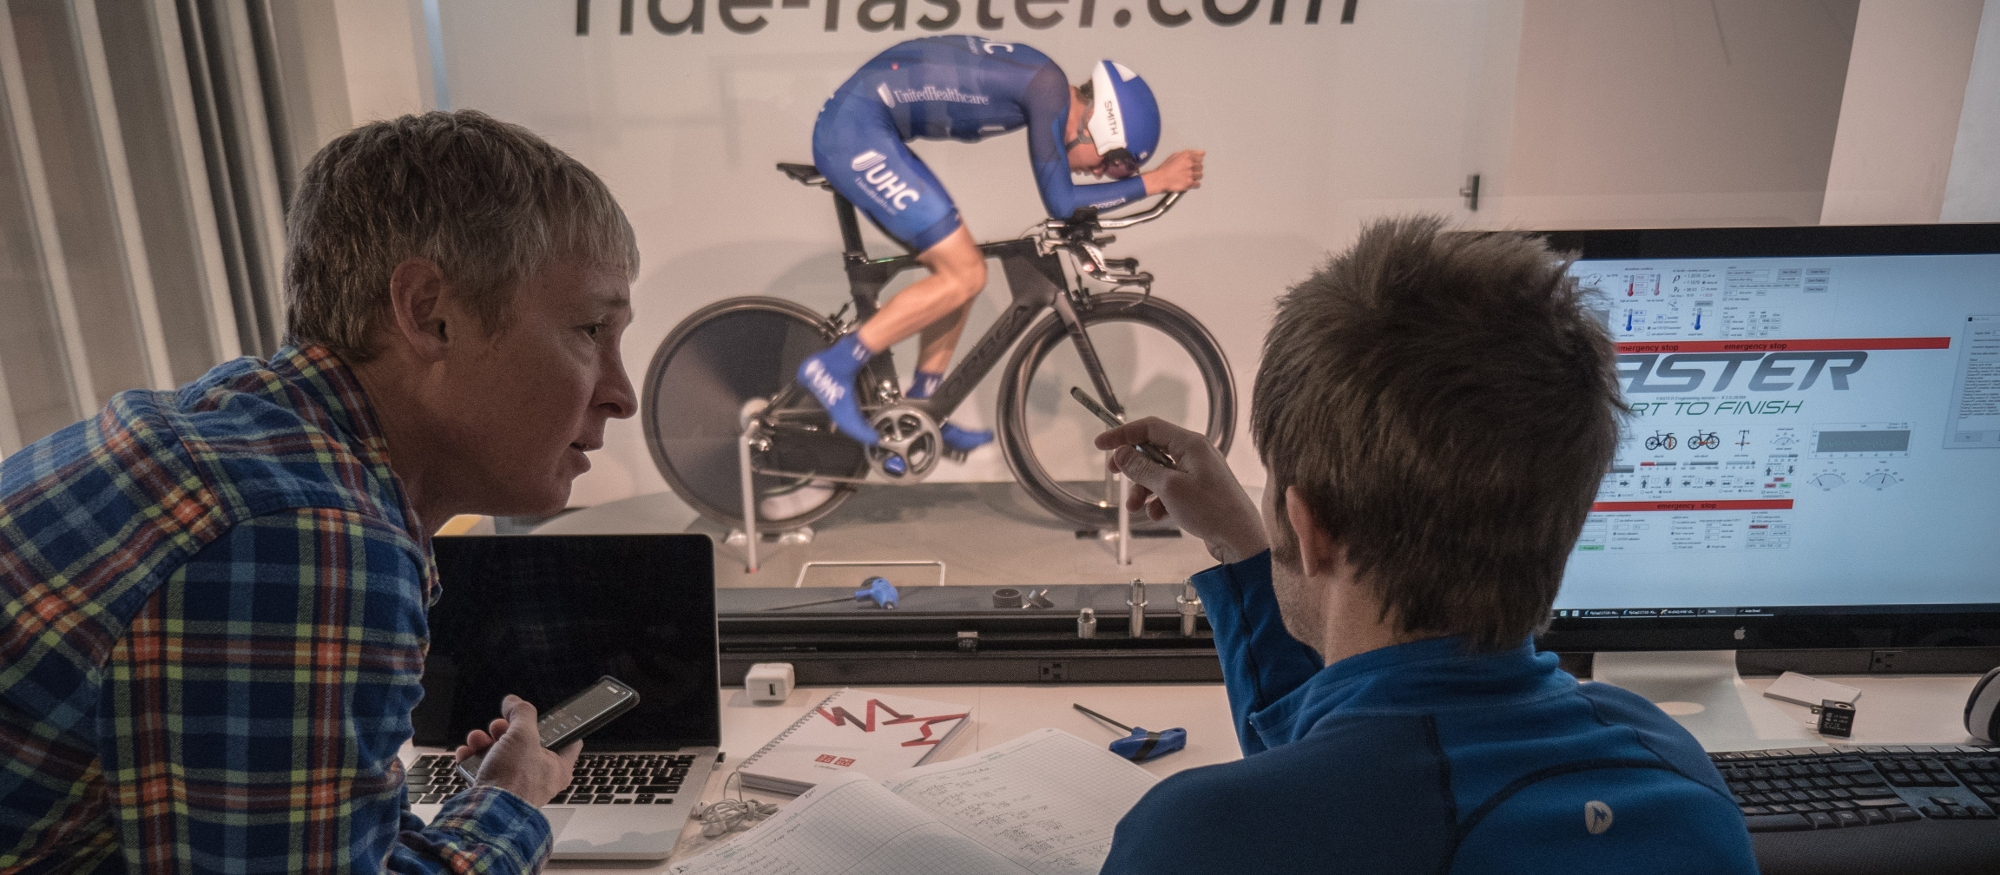
There are a few coaches and top pro teams that really dig into the numbers behind their performances and understand that cycling has been moving more toward a battle of data or as Ben puts it “our lives of swimming in numbers.” That is not to say that he or I believe that data is the end all be all, but for certain aspects in cycling the split-second difference can be found in the details. For this reason, it was an honor to be invited in early March to the UnitedHealthcare Pro Cycling time trial camp in Scottsdale, Ariz.; where the goal was to translate the the aero data we saw in the wind tunnel to the real-world experience on the road using our newly released Aero Analyzer feature.
This camp was a bit unique due to the fact that UHC members from both the men’s and women’s teams were there riding and testing together. The comradery amongst the team was amazing and everyone was excited to learn and, most importantly, get faster.
 |
 |
 |
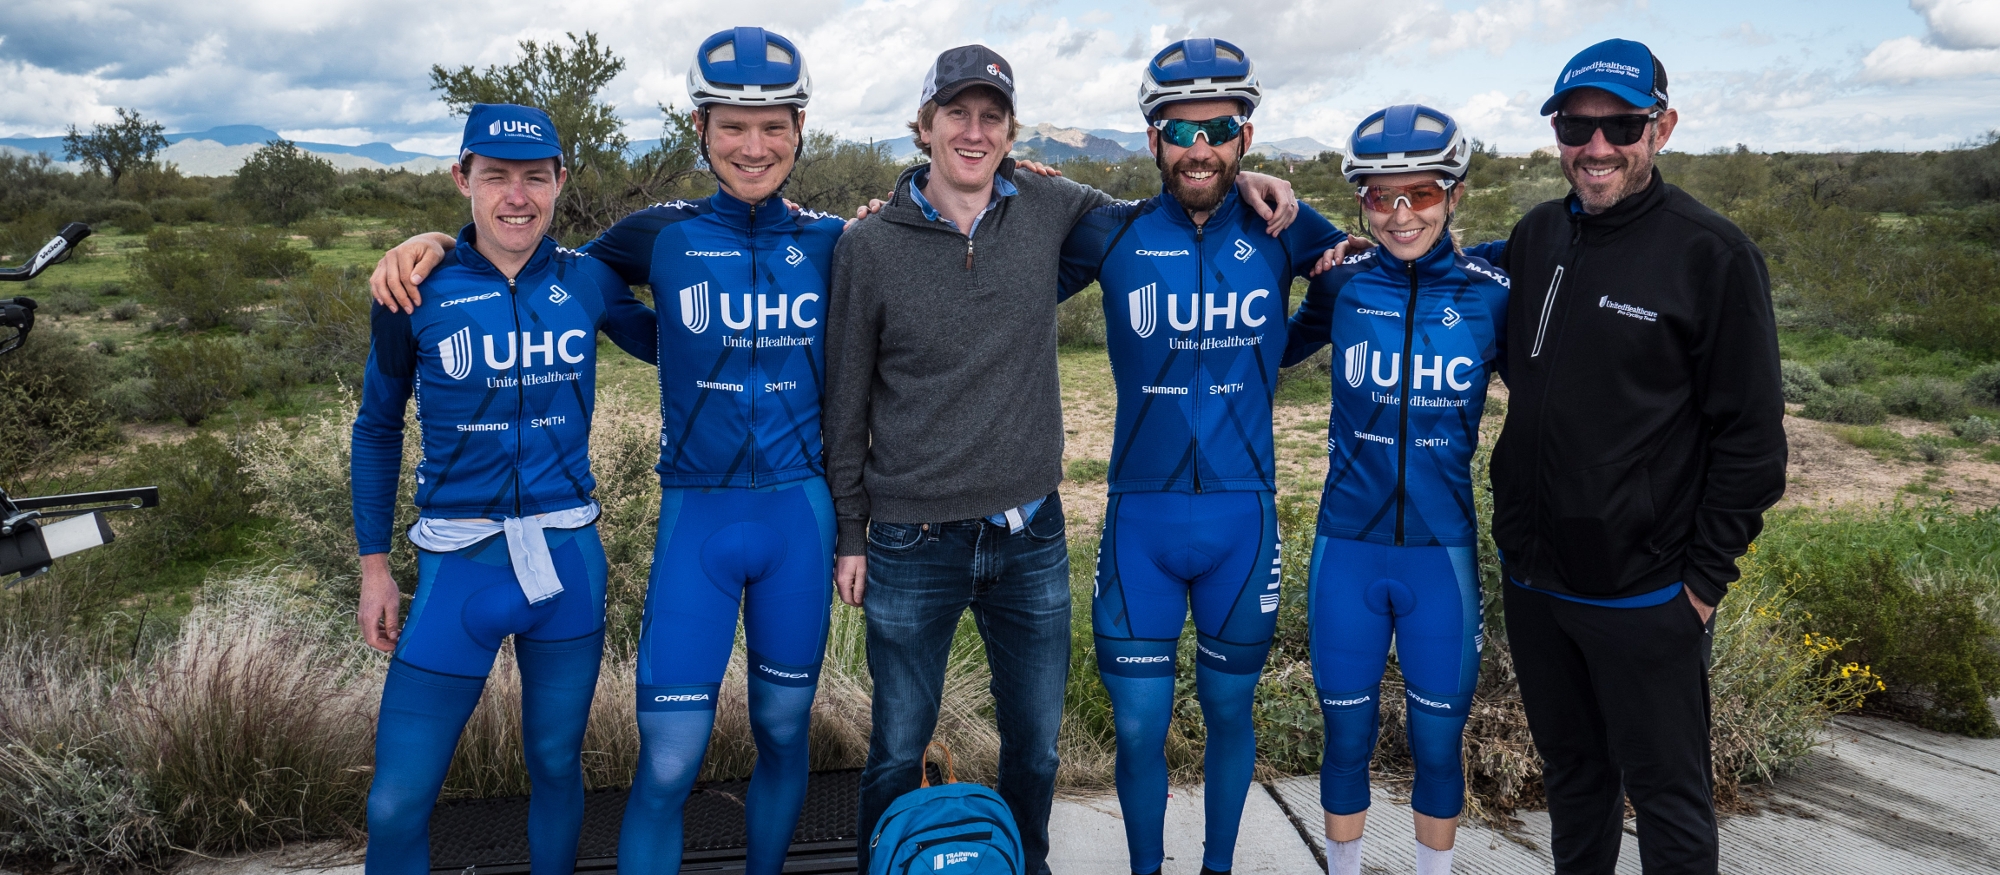
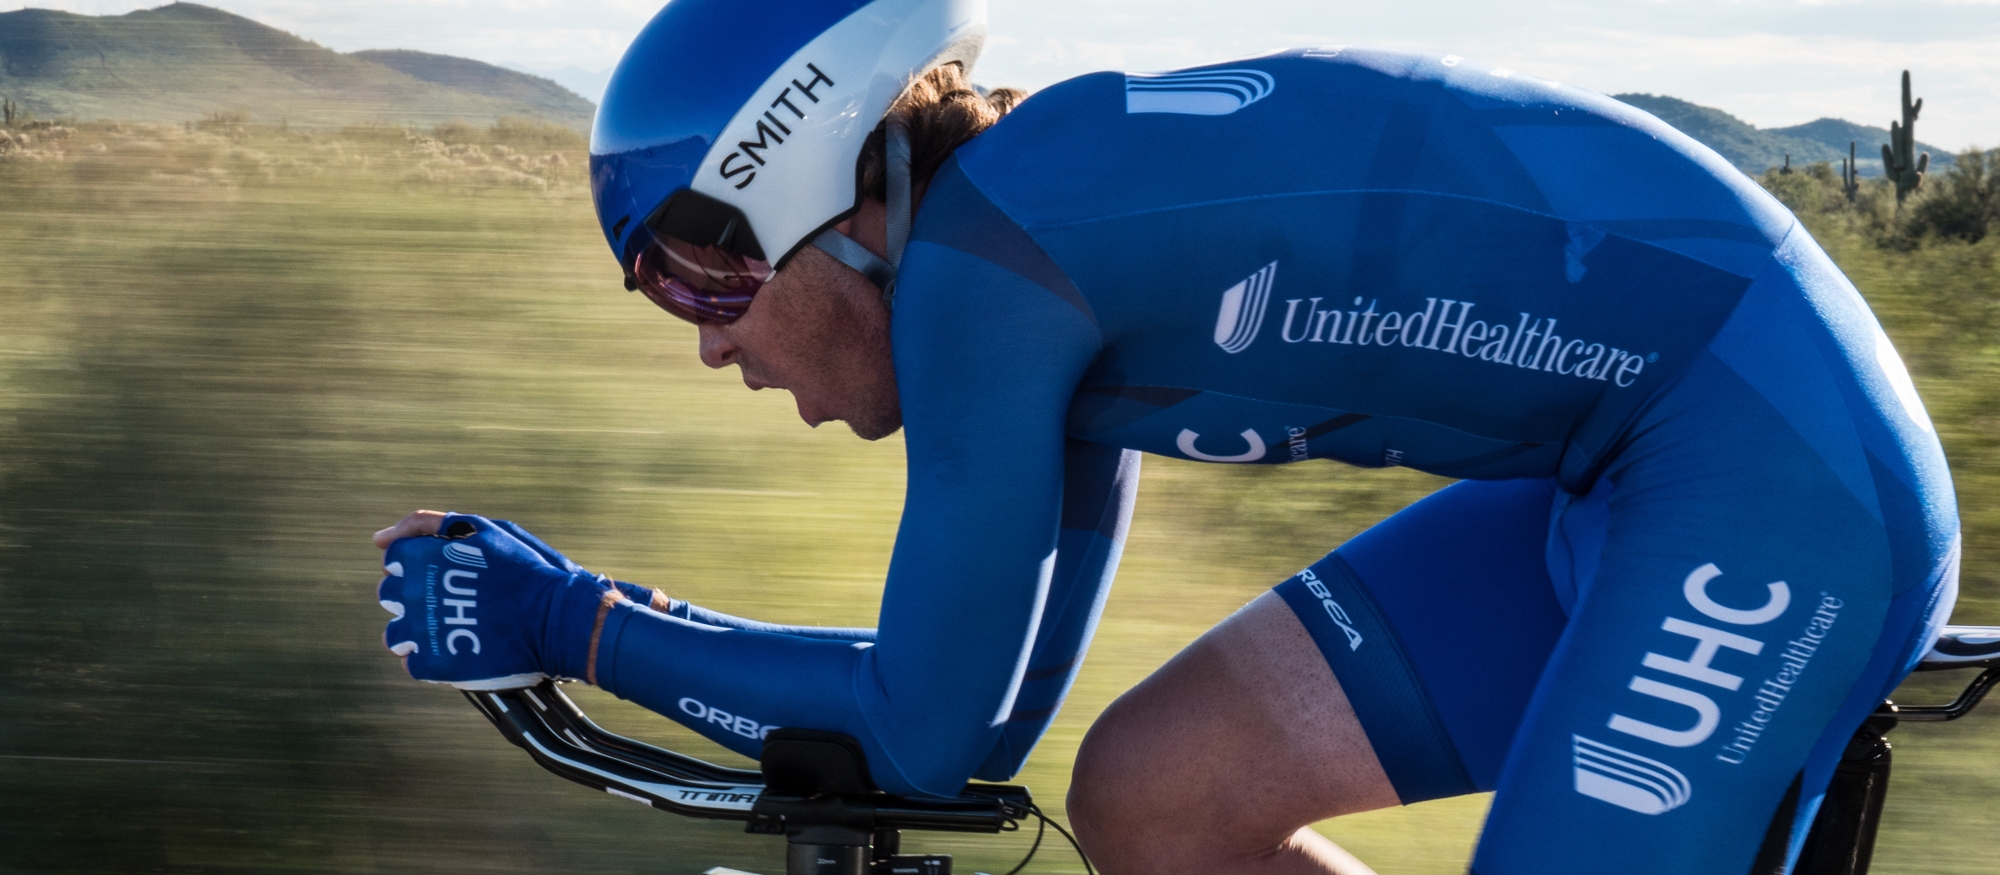
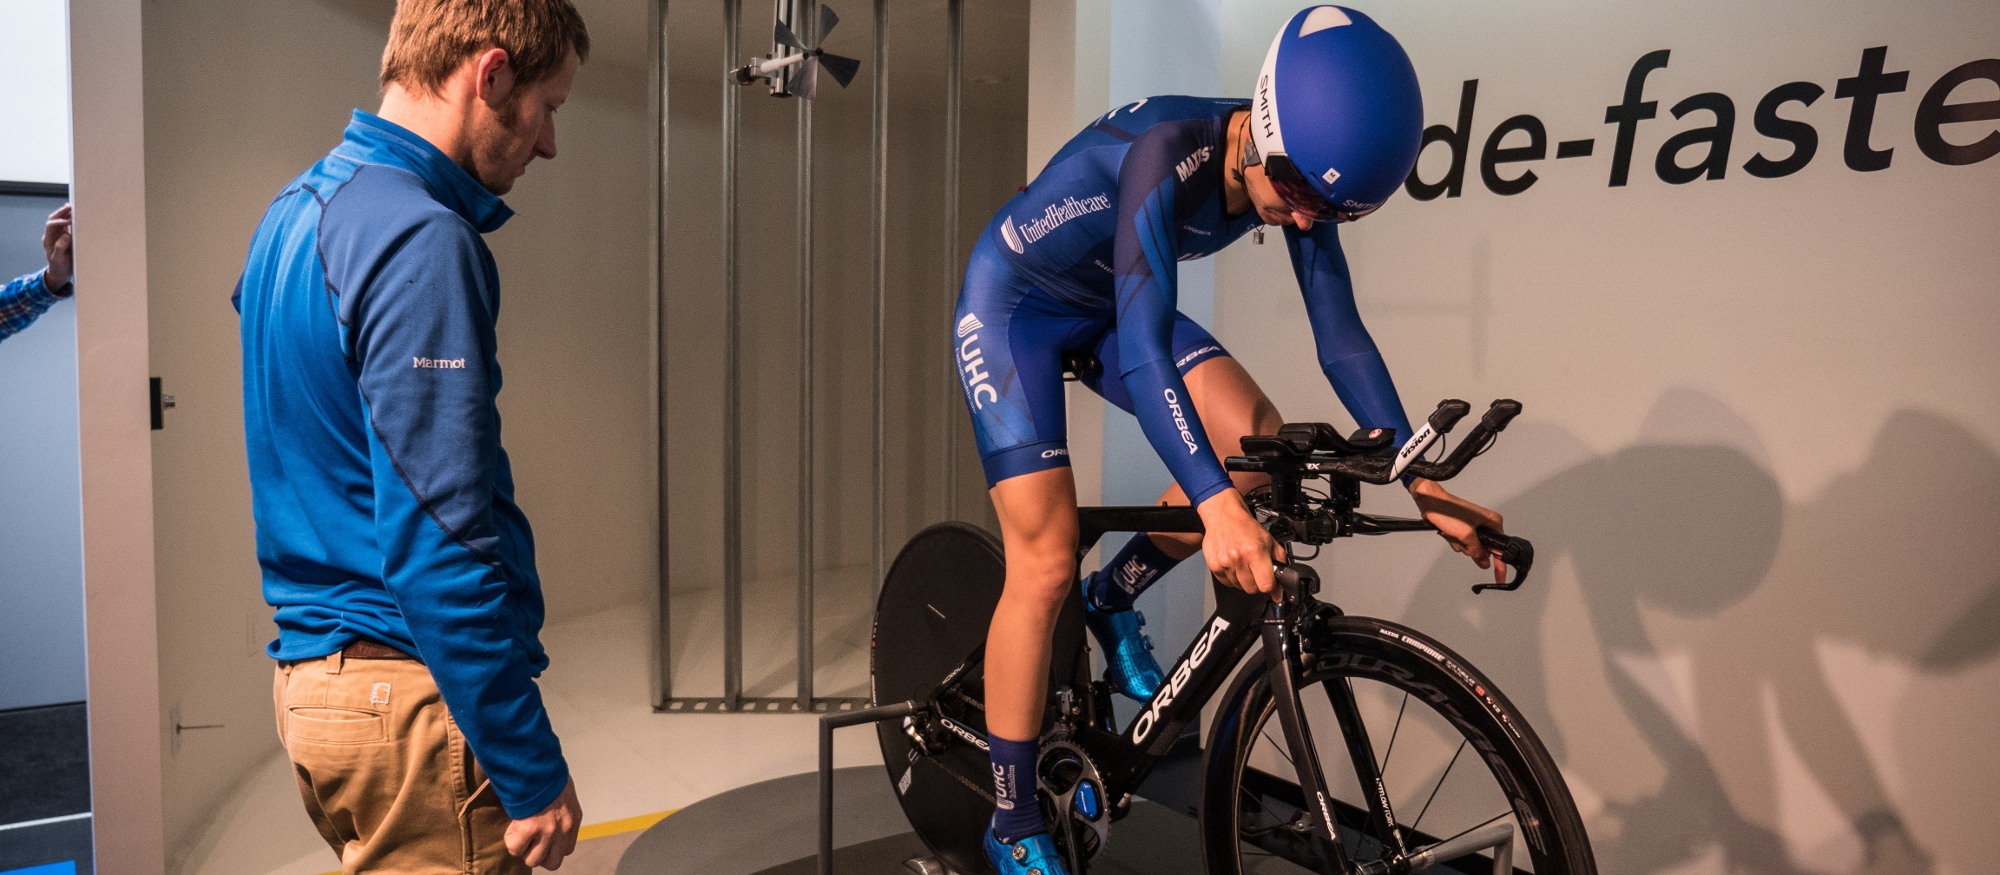
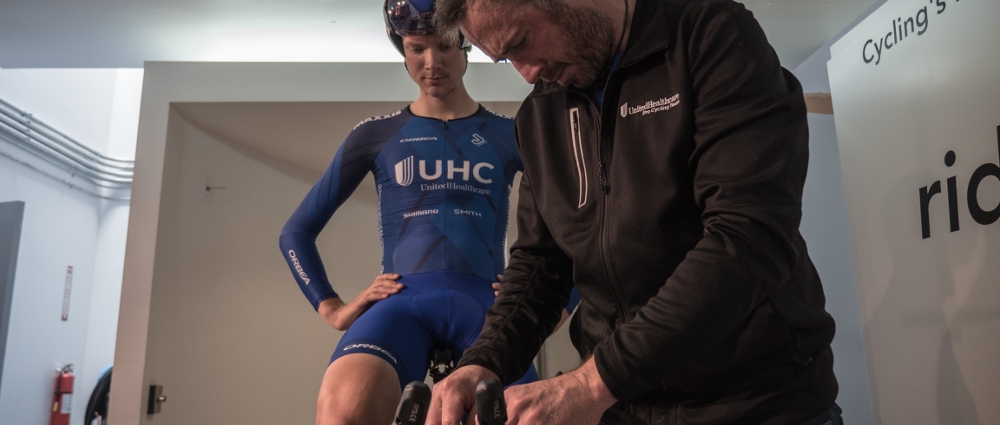
All told there were seven UHC riders at the camp: Katie Hall, Ruth Winder and Taylor Wiles from the women’s team and Alex Cataford, Daniel Eaton, Gavin Mannion and Jonny Clarke from the men’s squad. Each rider was given a couple of hours of tunnel time at the Faster Wind Tunnel in the first two days of the camp to dial in some baseline positions on their Orbea TT bikes (a new sponsor for the team this year). There are always some adjustments needed when changing bike sponsors as the frame size can vary quite a bit from each manufacture. In the case of Orbea several athletes needed to move a size down to make sure their measurements fit correctly (which conveniently tested a bit faster in the tunnel).
Once the initial tunnel runs were completed and results tabulated, a couple of standouts appeared in terms of low drag. This was expected from some of the smaller riders like Katie, Ruth, and Gavin, but rivaling their CdA was a relatively bigger rider Alex Cataford. Cataford has a very aggressive position, which gave spectacular tunnel numbers but gave rise to questions including whether or not his very aggressive position would translate to the road, and what would the impact in terms of drag be going from a very aggressive position to a slightly more sustainable position.
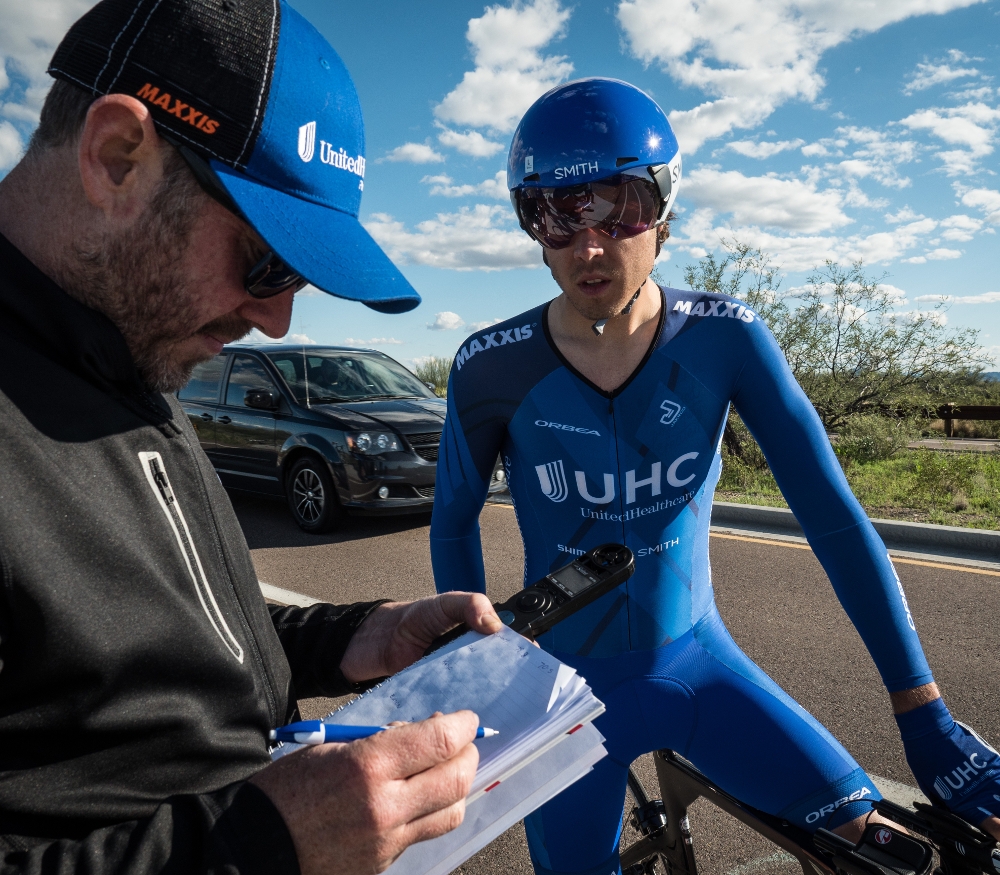
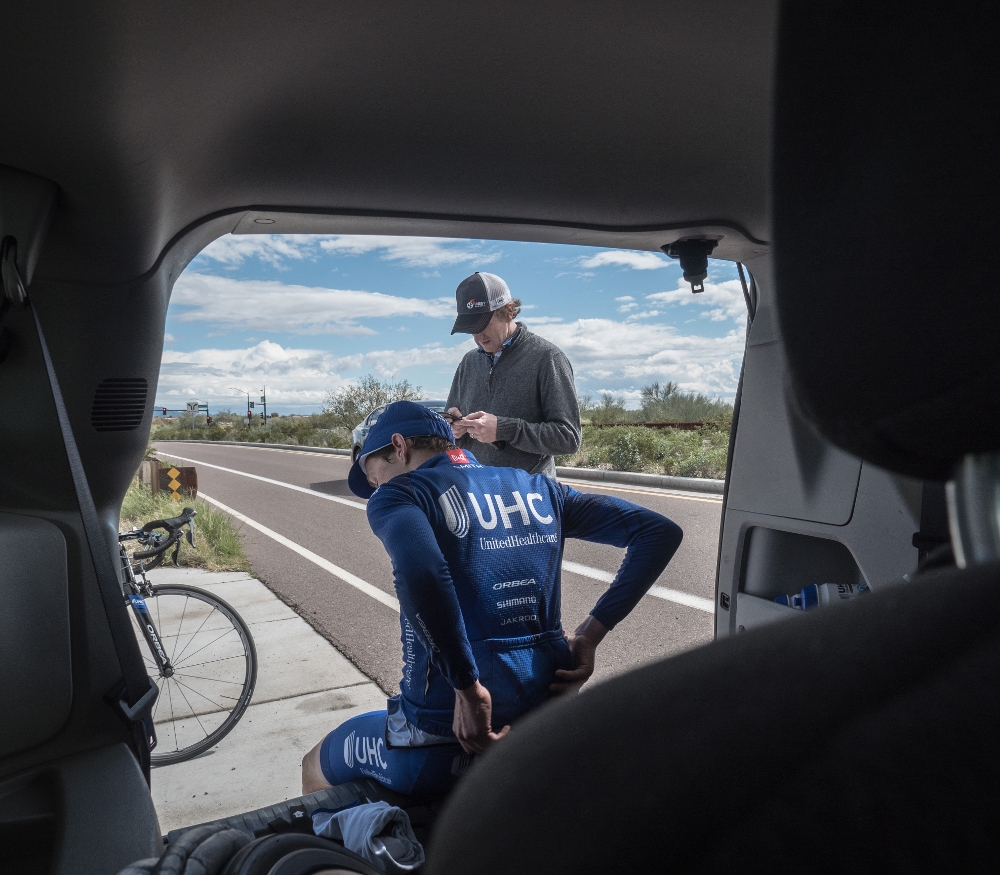
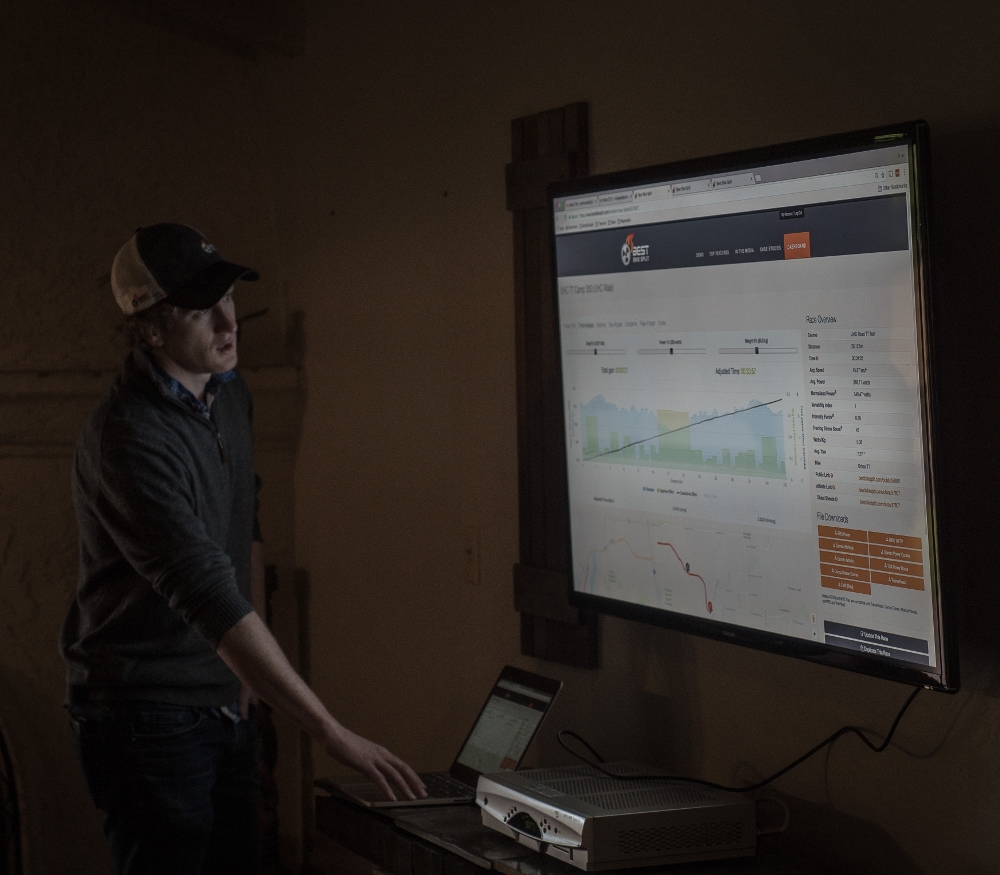
On day three of the camp it was time to take the riders outside and do some road tests on the new bikes with their adjusted positions. Before the test we ran a Best Bike Split model to show the riders the type of numbers we were hoping they could maintain. Instead of doing an individual model for each rider we generalized the plan into power ranges and gave them a standard cheatsheet based on the conditions they would face.
Because the course was mostly flat, riders would hold a fairly constant power level, however they were instructed to increase their power a bit into the headwind and back off with the tail wind. For riders in the 250 watt range that delta would be small at 5 to 10 watts. For those pushing more power the delta would be higher at +15 watts into the wind and -10 watts with the tail wind. By following the basic plan we could use the Best Bike Split Time Analysis tool to dial in drag and compare against our new Aero Analyzer drag estimation tool.
 |
 |
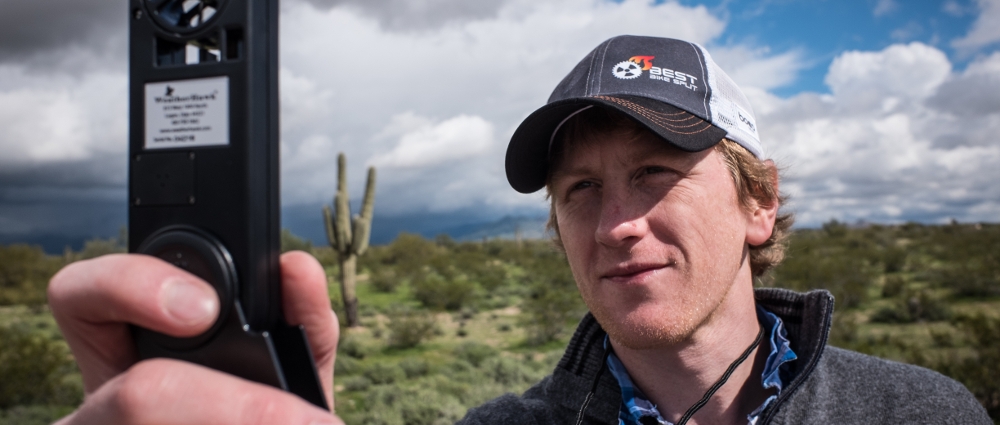 |
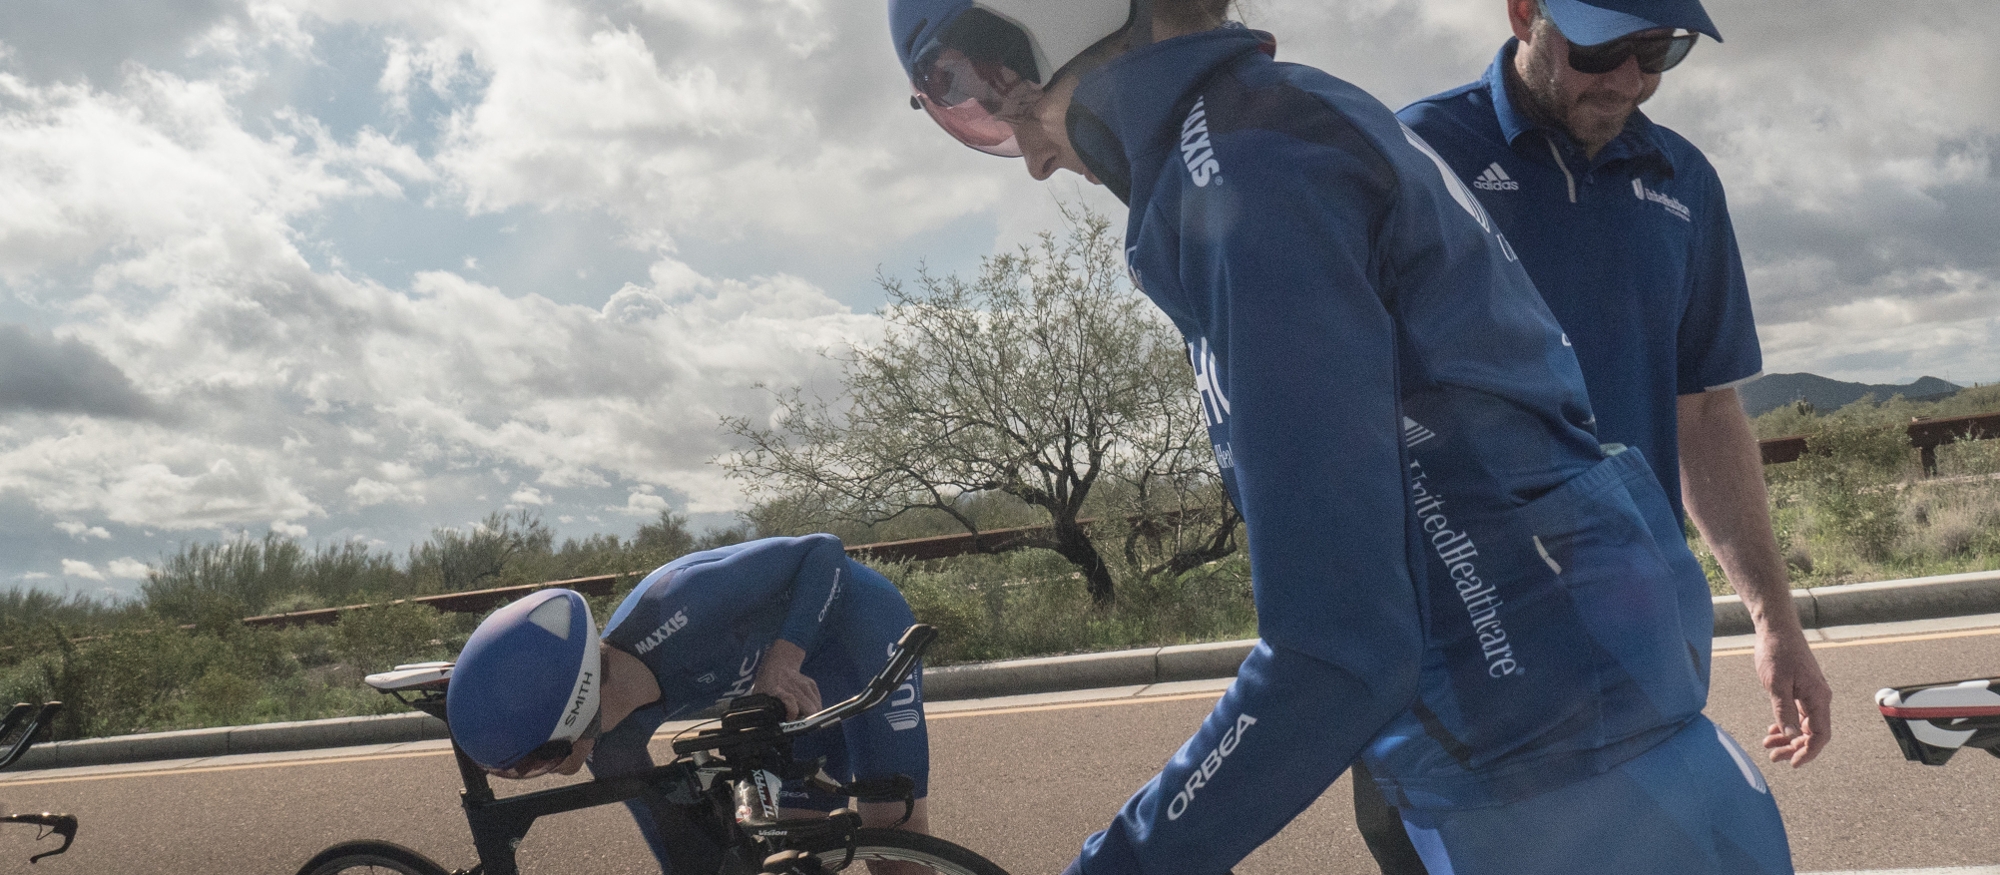
Once we were out on the course (after a short but extreme storm which wrecked havoc on our initial weather data) we started sending riders off on the TT ride. During the test runs we collected multiple weather data samples up and down the course to make sure our input data was as accurate as possible.
One thing we noticed almost immediately was that some of the more aggressive positions from the tunnel were just not maintainable on the road tests. In order to discover what the real impact of this was, we needed to dive into the data and run some analysis.
The Road Analysis
Our main goal for running the road tests was to validate that the numbers we saw in the tunnel could be applied to real-world modeling for UHC Pro Cycling throughout the season with Best Bike Split. We often see numbers coming out of various wind tunnels that seem very optimistic or in some cases flat out too good to be true. It’s not to say the tunnels are inaccurate in their controlled environment. The team at Faster (which has recently undergone an ownership change) were fantastic and the tunnel is amazing for determining the differences in minor position changes and various equipment combinations, which are much harder to determine with field test data. For performance modeling though we really wanted to make sure what we were seeing in the tunnel was realistic and could be translatable when riding out in the environment.
In our analysis we first focused very two very different sized riders whose positions and tunnel numbers were quite different. One particular rider Dan Eaton had a powerful but relaxed position in the tunnel, and after accounting for the wheel differences we found that his CdA calculated from the tunnel was within 1 percent of our on-road estimates. Without going into too many specifics on his CdA, we saw a very minimal impact in drag based on his position in the tunnel versus the road.
The CdA cluster data from our Aero Analyzer tool shows that other than a couple of spots Dan stayed in his aero position throughout the ride. The difference from Dan’s tunnel data to his raw road test numbers was a bit over 3 percent, which is primarily attributed to the difference at observed yaw angles between training wheels and race wheels (110 grams or ~ .01 CdA). Once we accounted for the specific race wheel set up the difference from the road trials to the tunnel was right at 1 percent.
This position allowed him to maintain a very high power throughout the ride and gave him the fastest time (31:06) out of the bunch for the test runs.
But how would this compare to some of the smaller, slightly more aerodynamic riders from the team?
At 59.6 kg (fully kitted up) Gavin Mannion is one of the smaller riders on the team, but while averaging about 60 watts less than Dan his time for the road test was less than 30 seconds slower at (31:35). Using the Aero Analyzer we estimated his CdA at 5 percent lower than Dan’s. This also matched with the difference found in the tunnel. With his reduced drag, had Gavin pushed an extra 10 watts (still a tall order) he would have matched Dan’s time out on course despite still being nearly 50 watts below Dan’s power average!
Looking at the remaining athletes we could see their deltas from the road to the tunnel tests along with some notes on the athletes testing. This data gives Ben Day at UHC Pro Cycling the confidence that the riders tunnel data can be used with Best Bike Split performance modeling to accurately plan out time trials throughout the season. For the riders where there were significant differences, additional analysis will need to be done to determine the potential causes which could range from an uncalibrated power meter to not being able to hold the same position from the tunnel in the real world. UHC is taking another batch of riders through the tunnel in April so more data points and additional testing will help fine tune the models even more.
 |
 |
 |
Of the athletes who maintained their position extremely well, deltas seen in the CdA measured inside of the tunnel compared to the road were extremely close. Using video from the tunnel to compare some of the athletes where the deltas were a bit high it was easy to see the clear differences, or in one case the huge impact of non-aerodynamic clothing.
Throwing out the worst two cases, the average difference from the remaining five riders CdA calculated from road tests versus the wind tunnel when accounting for race wheel reduction was 1.35 percent.
Where do we go from here?
The second goal for having riders complete the on-road time trial tests was to help us at Best Bike Split refine our new Aero Analyzer tool, to provide an accurate estimate of a rider’s aerodynamic drag based on real-world ride data. As we refine the Aero Analyzer we plan to enhance the outputs to highlight areas where innaccurate data could lead to poor CdA estimates. For more information on how to use and how to interpret the data please see our Intro to the Aero Analyzer case study.
While the tool will obviously not replace wind tunnel or velodrome testing we wanted to give our users the ability to dial in their drag numbers from past race data and easily test positions or equipment while out on longer training rides. We will continue to enhance the tool over time to improve accuracy and increase it’s usefulness so everyone from pro tour teams to amateur triathletes can reap the benefit. For UHC Pro Cycling the team looks strong and most importantly their aero positions are dialed in for a great season!